Hot Topics April 2017
We are pleased to report continued activity on a sales front unlike what we have seen over the past couple of years.
It feels like all of a sudden the gap between Sellers expectations and Buyers preparedness to transact has narrowed. So whilst prices have continued to drift down marginally (or gap down dramatically in the case of some developments – some astute Buyers have taken advantage of this!)) turnover has increased. Whilst turnover has increased the number of listings has not reduced (yet) as pent up Sellers see this activity as an opportunity to sell / upgrade / downsize. The prospect of price increases will materialise only once the volume of listings reduces, this will occur sporadically from suburb to suburb before trending down generally across all of Perth.
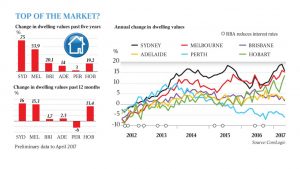
Whilst the local media appears to be reporting a lot more positive news about the property market locally, nationally the media is very focussed on Sydney / Melbourne and the intervention of regulatory bodies trying to curb those respective cities house price gains. Unfortunately the regulatory bodies levers are blunt and ultimately apply to the whole country and this is not something the Perth market wants or needs right now.
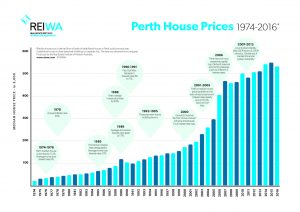
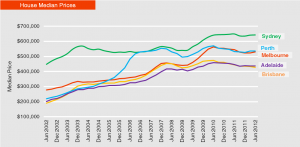
In preparing for my property market update to Clients of NCA next week I have come across some interesting statistics when analysing property price movement over time and across the capital cities of Australia. If you look closely you will see that in December 2006 the median price of property in Perth rivalled that of Sydney. In June 2010 Perth started the trajectory Sydney had been on since December 2003. It wasn’t until December 2012 that Sydney started a significant price growth phase, some 10 years since the previous growth phase. So what does all this mean for the medium term in Perth… more will be unveiled at next week’s presentation…and I would be happy to share this data with you post next Tuesday.
Richard
Sources: REIWA, CoreLogic (The Australian), Australia Property Monitors (Intercity)


